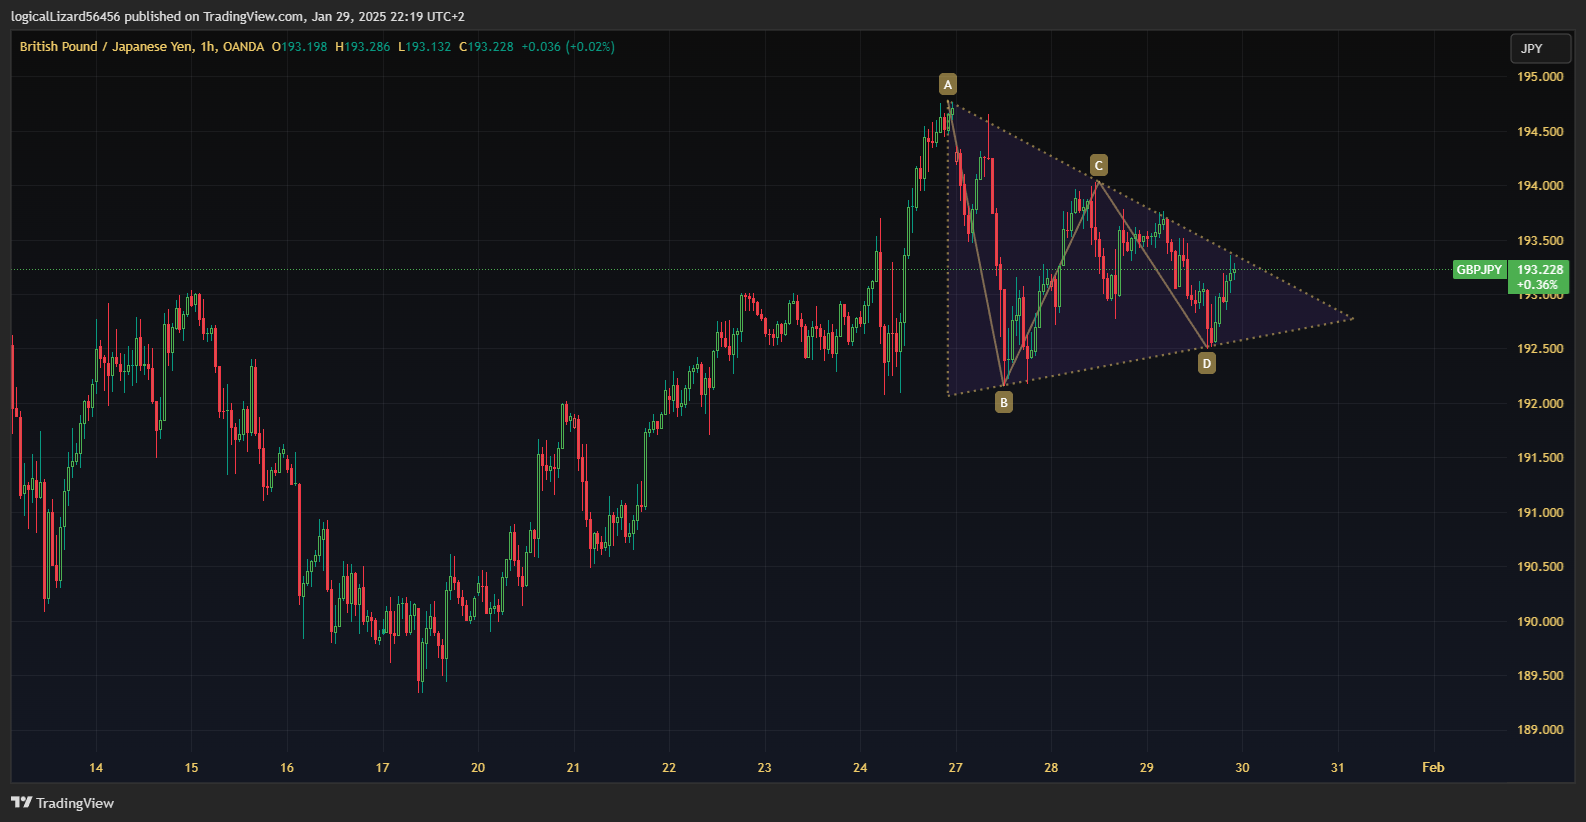
The GBP/JPY pair on the 1-hour timeframe has formed a symmetrical triangle, a common consolidation pattern that often precedes a breakout. This pattern consists of lower highs and higher lows, converging into a tighter range as price action coils within the formation.
Breakout Zone: The price is currently testing the upper boundary of the triangle around 193.30.
Key Levels and Structure
A to B: The initial sharp impulse move establishes the first swing high (A) and swing low (B), indicating volatility.
B to C: A strong bullish retracement follows but fails to create a new high, leading to a rejection at C.
C to D: Another bearish leg emerges, forming a higher low at D.